Facts, figures and dates
We have put together an overview of the key facts, figures and dates on our company, our work and the city of Berlin.
High level of supply reliability
Statistically, each Berlin resident will only lose their power supply once every five years. If there is an outage, however, a disruption will last an average of 50 minutes before the energy is flowing again.
Statistically speaking, in Berlin in 2024, every consumer spent approximately 8.7 minutes without electricity.1 For comparison: the same figure for Germany as a whole in 2023 was 12.8 minutes.2
Annual consumption of Berlin in 2024
12.3 TWh
Equivalent CO2 emission in 2024
~4.465 mio ton7
The determination of CO2 emissions is explained in our glossary.
| Circuit length4 | |
|---|---|
| Cables and wiring | 35,708 km |
| Cabling coverage | 99,3% |
| Incorporated high, medium and low voltage assets4 | |
|---|---|
| Substations | 71 |
| Grid knodes | 17 |
| Grid and customer stations | ~ 11,350 |
| Cable distribution cabinets (distributed at low voltage level) | ~ 16,700 |
In the metropolis on the Spree, 99 per cent of cables are underground. This means that they are well protected against external influences such as bad weather or lightning, although they can be damaged by underground building work.
Stromnetz Berlin GmbH will invest around 467 million euros5 on grid infrastructure in 2025, especially the expansion and maintenance of the distribution grid in Berlin. Nearly 60 per cent of this expenditure is going to companies from the Berlin-Brandenburg region. And that is still the case, even though all commissions over 430,000 euros are tendered across Europe.
| Geographical data4 | |
|---|---|
| Number of residents in the grid area | 3,803,134 |
| Geographical size of the grid area | 891.12 km2 |
| Investment in grid infrastructure5 | EUR ~467 million |
|---|---|
| Stromnetz Berlin GmbH's employees6 | 1,977 |
| Stromnetz Berlin GmbH's trainees6 | 144 |
Electricity generation with a future - local and renewable
There is a clear trend recognisable in Berlin, which will continue to increase over the next few years: alongside traditional electricity plants and CHPs, an increasing number of small, local generation plants are being integrated into our distribution grid. These include photovoltaic plants, wind turbines, thermal power stations in a wide range of sizes and bioenergy plants.
This trend can also be seen in tenant power systems, where in most cases CHP units are used to generate energy.

Tenant power systems evolution in Berlin
The photovoltaic plants and wind turbines represent a particular challenge for us: they do not produce a constant supply of energy. The time at which generation occurs and the amount of energy generated depend on how the wind is blowing and the sun is shining. However, there are also several smaller local generation plants, e.g. small thermal power stations, which feed in regardless of actual demand.
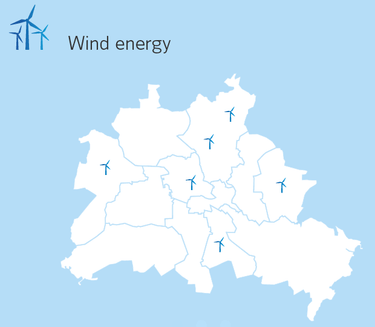
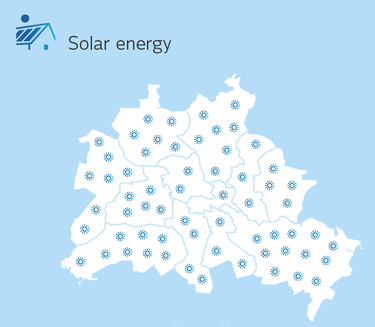
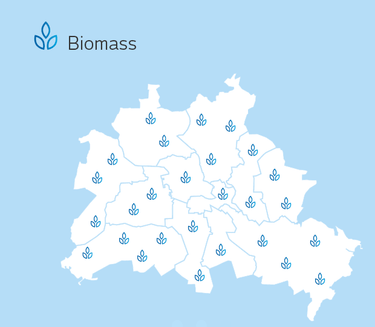
Plants in Berlin
Distribution across the urban area


Number and generation by plants in Berlin (in 2023)

| Number of installations | 7 |
|---|---|
| Installed capacity (in MW) | 12 |
| Energy generated (in GWh) | 25 |

| Number of installations | 25,892 |
|---|---|
| Installed capacity (in MW) | 272 |
| Energy generated (in GWh) | 92 |

| Number of installations | 45 |
|---|---|
| Installed capacity (in MW) | 43 |
| Energy generated (in GWh) | 160 |
1 The average duration of an interruption at low voltage (0.4 kV) due to causes at all voltage levels (110/10/0.4 kV), excluding interruptions caused by force majeure, value for 2024 is provisional.
2 Federal Network Agency, SAIDIEnWG-Wert 2023, www.bundesnetzagentur.de
3 This data has not been published under statutory publication obligations.
4 The deadline is 31 December 2024.
5 Planned Investment in 2025
6 Status December 2024
7 based on an annual electricity volume of 12.3 TWh in 2024; for 2024, the CO2 emission factor from the Federal Environment Agency is estimated.
